

Markets in a Minute - The Push Pull: Iran Worries Fade, AI Excitement Returns
Key Takeaways
- The S&P 500 rose 10.2% year to date, supported by robust corporate earnings, the artificial intelligence (AI) boom and other signs of economic strength.
- Bond yields move higher as inflation pressures mounted and investors priced in the possibility of a Federal Reserve rate increase. Even so, the broad U.S. fixed-income market managed a modest 0.62% year-to-date gain.
- Beyond the AI buzz, several asset classes that had lagged for years continued to stage a quiet comeback, rewarding investors with broadly diversified portfolios.
For much of this year, markets have been caught between two opposing forces: exuberance around the AI boom and unease over the Iran conflict and its economic fallout.
In the first quarter, the Iran conflict took center stage. Amid a conflict-driven spike in oil prices, the market saw its first quarterly loss in a year. By the end of the second quarter, AI was pretty much back in the driver’s seat.
Renewed enthusiasm around AI — along with a fragile U.S.-Iran pact to wind down the war and reopen the vital Strait of Hormuz waterway — helped push the market into positive territory for the year. It also provided fertile ground for SpaceX’s record-setting initial public offering, one of the most-visible signs of a long-awaited rebound in IPO activity.
In this week’s Markets in a Minute, we dig into highlights from the second quarter, including areas of market strength that have grabbed fewer headlines than the AI boom. We also touch on some reasons for cautious optimism heading into the second half of the year, along with risks that could shape the outlook.
AI Gets its Mojo Back
What’s behind the renewed excitement around AI?
For starters, AI-sector revenues are booming, driven by strong corporate and consumer demand. While it’s too early to draw broad conclusions, the growth is seen by some as a sign that the hundreds of billions of dollars tech companies are pouring into AI infrastructure could translate into meaningful earnings over time.
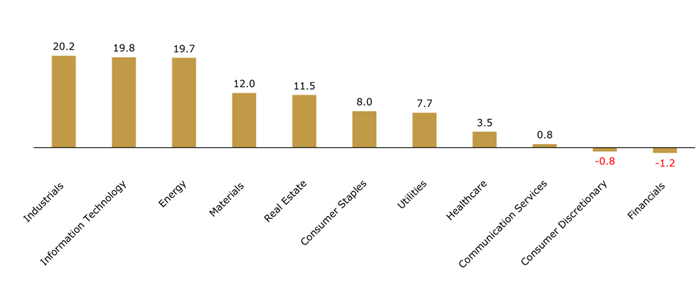
Spending on AI infrastructure by just four big technology companies is expected to reach roughly $725 billion this year. By some accounts, that’s a bigger investment as a share of the economy than the railroad expansion of the 1850s, and it’s already showing up in the earnings of chipmakers, cloud infrastructure providers and other businesses involved in the historic AI infrastructure build-out. The enthusiasm has even extended to sectors such as Utilities, where stocks have benefited from expectations that data centers will continue to drive substantial growth in electricity demand.
S&P 500 Sector Performance (January through June 2026)
Past performance is not a reliable indicator of current or future results. Indexes are unmanaged and not subject to fees. It is not possible to invest directly in an index. Note: views are from a U.S. dollar perspective. Data labels represent total year-to-date returns. This material represents an assessment of the market environment at a specific time and is not intended to be a forecast or guarantee of future results. Source: S&P and FactSet. Index proxies: S&P 500 Index sectors. Data as of June 30, 2026.
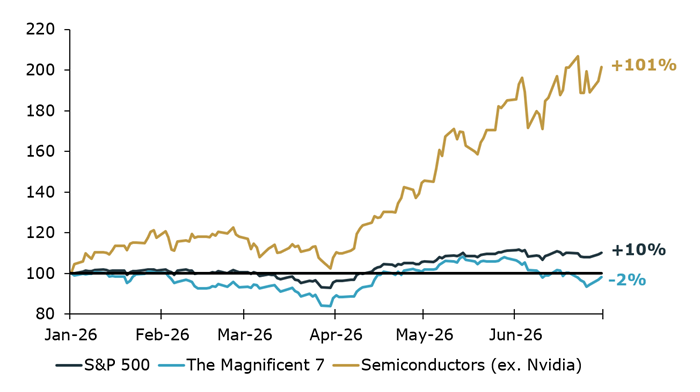
Investor enthusiasm for AI has also become a major driver of market leadership and concentration. The Information Technology and Communication Services sectors together accounted for 48% of the S&P 500’s total market capitalization as of June 30, 2026. However, sector performance has diverged sharply, with Information Technology gaining 19.8% year-to-date compared with just 0.8% for Communication Services. Notably, the gains extend well beyond the Magnificent 7, as semiconductor manufacturers, cloud infrastructure, and other AI-enablement companies have contributed meaningfully to sector returns.
S&P 500, Magnificent 7, Semiconductor Performance (Indexed to 100)
Past performance is not a reliable indicator of current or future results. Indexes are unmanaged and not subject to fees. It is not possible to invest directly in an index. Note: views are from a U.S. dollar perspective. Data labels represent total year-to-date returns. This material represents an assessment of the market environment at a specific time and is not intended to be a forecast or guarantee of future results. Source: S&P and FactSet. Index proxies: S&P 500, The Magnificent 7 is equally weighted and represents Microsoft, Amazon, Meta, Nvidia, Google, Apple, Tesla. Semiconductors represent the top 10 equally weighted names in the SMH index, excluding Nvidia. Data as of June 30, 2026.
Beyond the Headlines
With all the fuss over AI, it can be easy to overlook other areas of strength in the markets. Ultimately, companies’ ability to earn is what drives the markets, and earnings power has been robust across company sizes, geographic markets and more.
For instance, earnings for large-cap stocks have exceeded expectations by a lot. In the first quarter, earnings for S&P 500 company stocks grew by nearly 29%, the highest growth rate since the fourth quarter of 2021 and about twice the projected earnings-growth rate at the start of the year.
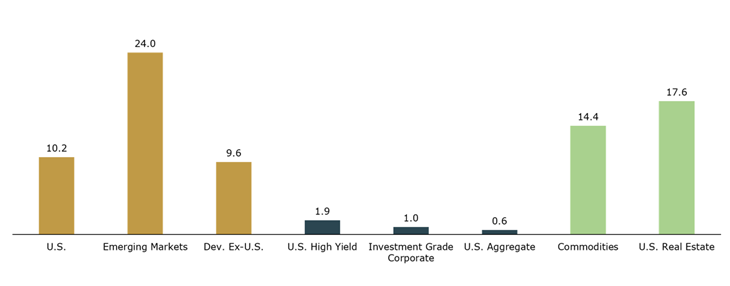
Meanwhile, small-cap stocks have rallied after years of playing underdog. Year to date, small caps have returned roughly 23%, compared to about 10% for the S&P 500. The rally has been underpinned by relatively low valuations, a reacceleration in earnings and renewed investor interest in the space.
International stocks have continued to be competitive this year. Through June 30, international markets generated returns in line with U.S. equities. Investors have been looking beyond the U.S. for more-attractive valuations and faster earnings growth.
Emerging markets have been one of the best-performing asset classes year to date. However, it’s worth noting that performance has been concentrated in just two markets, South Korea and Taiwan. Both are central players in the AI build-out, thanks to their strength in semiconductor manufacturing and other areas of technology. They’ve become popular among investors seeking exposure to the AI boom, but that also makes them vulnerable to shifting sentiment around AI.
Investors may find meaningful performance differences among emerging-market ETFs, particularly where index methodologies differ on South Korea’s classification. For example, MSCI classifies South Korea as an emerging market, while several other widely used emerging-market benchmarks classify it as a developed market. Given South Korea’s strong performance this year, that distinction has contributed to meaningful return differences among emerging-market ETFs.
Collectively, Taiwan and South Korea now represent a larger share of the MSCI Emerging Markets Index than China, roughly 51% versus 19%. For much of the last decade, China has dominated the index.
Global Market Returns, % (January through June 2026)
Past performance is not a reliable indicator of current or future results. Indexes are unmanaged and not subject to fees. It is not possible to invest directly in an index. Note: views are from a U.S. dollar perspective. Data labels represent total year-to-date returns. This material represents an assessment of the market environment at a specific time and is not intended to be a forecast or guarantee of future results. Source: Kestra Investment Management with data from FactSet. Index proxies: Bloomberg U.S. Aggregate, ICE BofA U.S. Corporate, ICE BofA U.S. High Yield, S&P 500, MSCI EM, MSCI World ex U.S., Dow Jones U.S. Select REIT, and Bloomberg Commodity Index. Data as of June 30, 2026.
Yields Rise, Opportunity Knocks
The bond market has had a rough ride this year, but there’s a silver lining: The Bloomberg U.S. Aggregate Index has managed a modest 0.62% gain year to date through June 30, despite rising yields and shifting Fed expectations.
Inflation was already elevated when the Iran conflict began in late February, and price pressures have only intensified since then. Lofty energy prices have not only pushed up the cost of many goods but also contributed to higher prices for transportation and other services.
The inflation picture has created a conundrum for the Fed. At the start of the year, markets widely expected the central bank to cut its benchmark short-term interest rate. Instead, the Fed is now expected to keep rates higher for longer or increase rates if inflation continues to trend in the wrong direction.
The shift in expectations has weighed on bond prices and pushed yields higher. In May, Kevin Warsh succeeded Fed Chair Jerome Powell, adding a layer of uncertainty around the direction of monetary and other policy. (Read our recent analysis on the big changes that could be on the way at the Fed.)
As of the second quarter, starting yields were near their highest levels in decades across many parts of the bond market, including select international markets. The good news is that higher starting (or initial) yields give investors opportunities to earn more income upfront, which can set a stronger foundation for future returns.
Hanging Tough
The U.S. economy continued to demonstrate remarkable resilience during the first half of this year despite hotter inflation and other headwinds.
Productivity growth and capital investment (particularly tied to AI) have been strong, and the labor market seems to be climbing out of its recent rut, as measured by monthly job gains. The unemployment rate (4.3% in May) has been hovering at historical lows.
On the surface, consumer spending, which accounts for a whopping 68% of gross domestic product, has held up surprisingly well. But higher prices have begun to put a strain on lower-income consumers, exacerbating the country’s growing economic divide (or the so-called K-shaped economy).
On earnings calls, the management teams of consumer-facing companies are increasingly talking about the shifting habits of lower-income Americans, who are reportedly reining in spending on everything from dining out to home appliances. Meanwhile, higher-income consumers, who have benefitted from rising stock prices, continue to spend freely on travel and other big-ticket items.
The Road Ahead
The longer inflation remains elevated the greater the economic toll. So, it’s not surprising that markets and many consumers and lawmakers breathed a collective sigh of relief when the U.S. and Iran signed a memorandum of understanding in mid-June to begin winding down the war.
By the end of the second quarter, West Texas Intermediate, the main U.S. crude oil benchmark, was down 31% from the end of March, signaling market confidence that shipping through the Strait of Hormuz will begin to normalize. That said, the situation remains fluid, with both sides trading threats even as fragile peace negotiations continue.
While the Iran conflict may recede from the headlines in the months ahead, the AI boom will remain front and center for the foreseeable future. Two more high-profile AI-related IPOs are slated for later this year, generating significant investor interest and speculation.
It’s worth noting that historically IPO performance has been underwhelming. What’s more, it can take months for newly public companies to be added to major indexes. That means most investors likely won’t get exposure to high-profile IPOs until the initial excitement has played out. (For insight on the long-term implications of the AI boom, watch our recent video on AI’s Second Act.)
We’ll continue to monitor geopolitical risk, the AI buildout, inflation and other developments that have been moving markets. Keep in mind, though, that markets often react to headlines, but wealth is built over time.
Invest wisely and live richly,
Kara
The opinions expressed in this commentary are those of the author and may not necessarily reflect those held by Kestra Advisor Services Holdings C, Inc., d/b/a Kestra Holdings, and its subsidiaries, including, but not limited to, Kestra Advisory Services, LLC, Kestra Investment Services, LLC, Kestra Private Wealth Services, and Bluespring Wealth Partners, LLC. The material is for informational purposes only. It represents an assessment of the market environment at a specific point in time and is not intended to be a forecast of future events, or a guarantee of future results. It is not guaranteed by any entity for accuracy, does not purport to be complete and is not intended to be used as a primary basis for investment decisions. It should also not be construed as advice meeting the particular investment needs of any investor. Neither the information presented nor any opinion expressed constitutes a solicitation for the purchase or sale of any security. This material was created to provide accurate and reliable information on the subjects covered but should not be regarded as a complete analysis of these subjects. It is not intended to provide specific legal, tax or other professional advice. The services of an appropriate professional should be sought regarding your individual situation. Kestra Advisor Services Holdings C, Inc., d/b/a Kestra Holdings, and its subsidiaries, including, but not limited to, Kestra Advisory Services, LLC, Kestra Investment Services, LLC, Kestra Private Wealth Services, and Bluespring Wealth Partners, LLC, do not offer tax or legal advice.